Central Monitoring Dashboard (CMD)
Overview
Central Monitoring Dashboard (CMD) is a tool created by BlockApps to help administrators monitor and overview the state of their STRATO networks. It is available to the administrators as an installable service along with STRATO.
CMD provides the API access to get the network health externally - to integrate the uptime monitoring and incident management tools of your choice. It also has a user interface to provide the visual picture of the network to a STRATO network administrator.
Unlike the health endpoints in the STRATO API or the health status in the STRATO Management Dashboard (SMD), CMD provides a network-level view instead, based on the data obtained from the nodes and processed on the CMD server.
CMD is deployed as a set of Docker containers and consists of:
- Backend container (NodeJS, ExpressJS)
- UI container (NodeJS, React)
- Postgres database
- Nginx reverse-proxy (Openresty w/Lua)
- HTTP redirect service
- A simple Nginx container used to redirect http:// -> https://
- Designed to be safely stopped in a live deployment during the Certbot TLS certificate renewal process which requires the port 80 to be vacant
Key Features Overview
Authentication
Based on the administrator's access management preference, CMD can be deployed with authentication enabled or disabled.
With authentication enabled, CMD utilizes the OAuth 2.0 protocol with OpenID Connect layer on top of it for authentication and authorization - similar to STRATO.
For more information about identity servers and OAuth 2.0 in STRATO, refer to User Identity & Authorization.
TLS Certificates
CMD can run on HTTPS out of the box. This requires a TLS certificate and the corresponding key. The BlockApps' Letsencrypt Tool is packaged with CMD to automate the process of obtaining and renewing TLS certificates. See Obtaining TLS certificate for more information about the tool.
Network Health API
CMD exposes two API endpoints providing the information about the network's health:
Public endpoint
The endpoint accessible without authentication.
- Provides the high-level status of the network ("needsAttention").
- Can be used to poll the health status by external monitoring services.
- Provides other discrete data under "healthPublicInfo", used to calculate the "needsAttention" status (to be removed from the public endpoint's output in the future releases)
Endpoint
GET https://<cmd_address>/health
Example
curl -X GET \
 -H "Accept: application/json" \
 https://<cmd_address>/health
Response
{
  "needsAttention": false,
  "healthPublicInfo": {
    "latestHealthStatus": true,
    "isOverallHealthy": true,
    "isOverallStalling": false,
    "hasUnHealthyNodes": false,
    "hasSyncingNodes": false,
    "hasWarnings": false
  }
}
Protected endpoint
The endpoint requiring an access token (does not apply to deployments running without authentication feature enabled.)
- Provides the detailed health data, the network-wide blockchain information and any warning messages if applicable (e.g. "Low memory" or "Vault password is not set" etc.)
- Can be used by administrators to obtain additional info programmatically.
Endpoint
GET https://<cmd_address>/server/health
Example
curl -X GET \
 -H "Authorization: Bearer <token>" \
 -H "Accept: application/json" \
 https://<cmd_address>/server/health
Response
{
  "healthInfo": {
    "latestHealthStatus": true,
    "isOverallHealthy": true,
    "isOverallStalling": false,
    "unHealthyNodes": "node5.example.com:8080",
    "syncingNodes": "node4.example.com:8081",
    "warnings": [{"node3.example.com:8080": ["Low Memory", "Low disk space"]}, {"node2.example.com:8080":  ["Vault Password is not set"]}]
  }
}
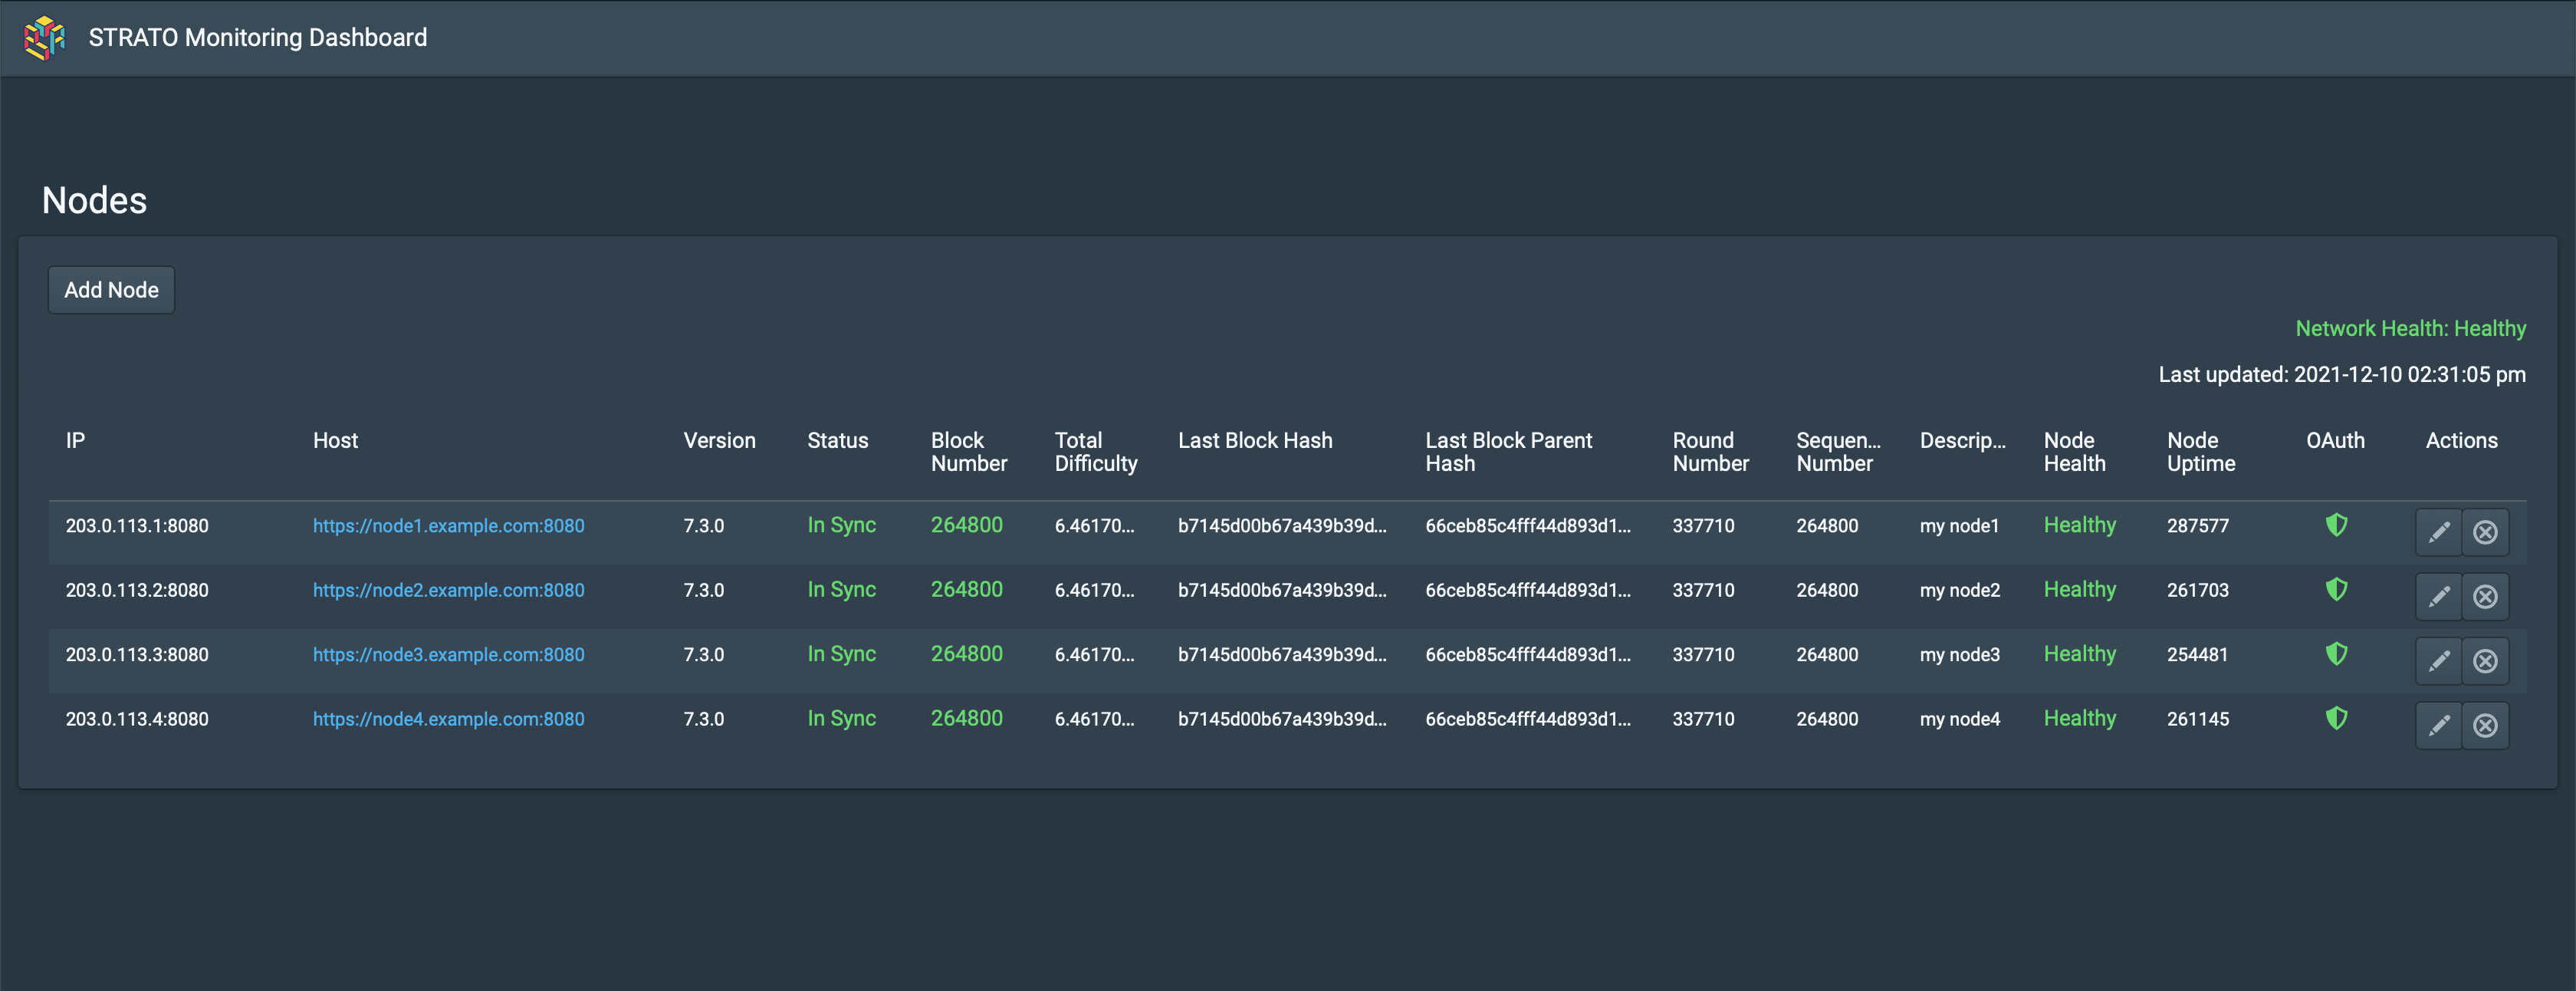
User Interface
CMD exposes the Dashboard as a single-page web UI.
The Dashboard utilizes the WebSockets Protocol for two-way communication between a server and a browser to achieve live UI data updates without HTTP polling.
The Dashboard consists of a node list represented with an interactive table and the network's overall health status:
Node List Management
The nodes can be added to the list at CMD's boot time by providing the list in a form of a JS template file.
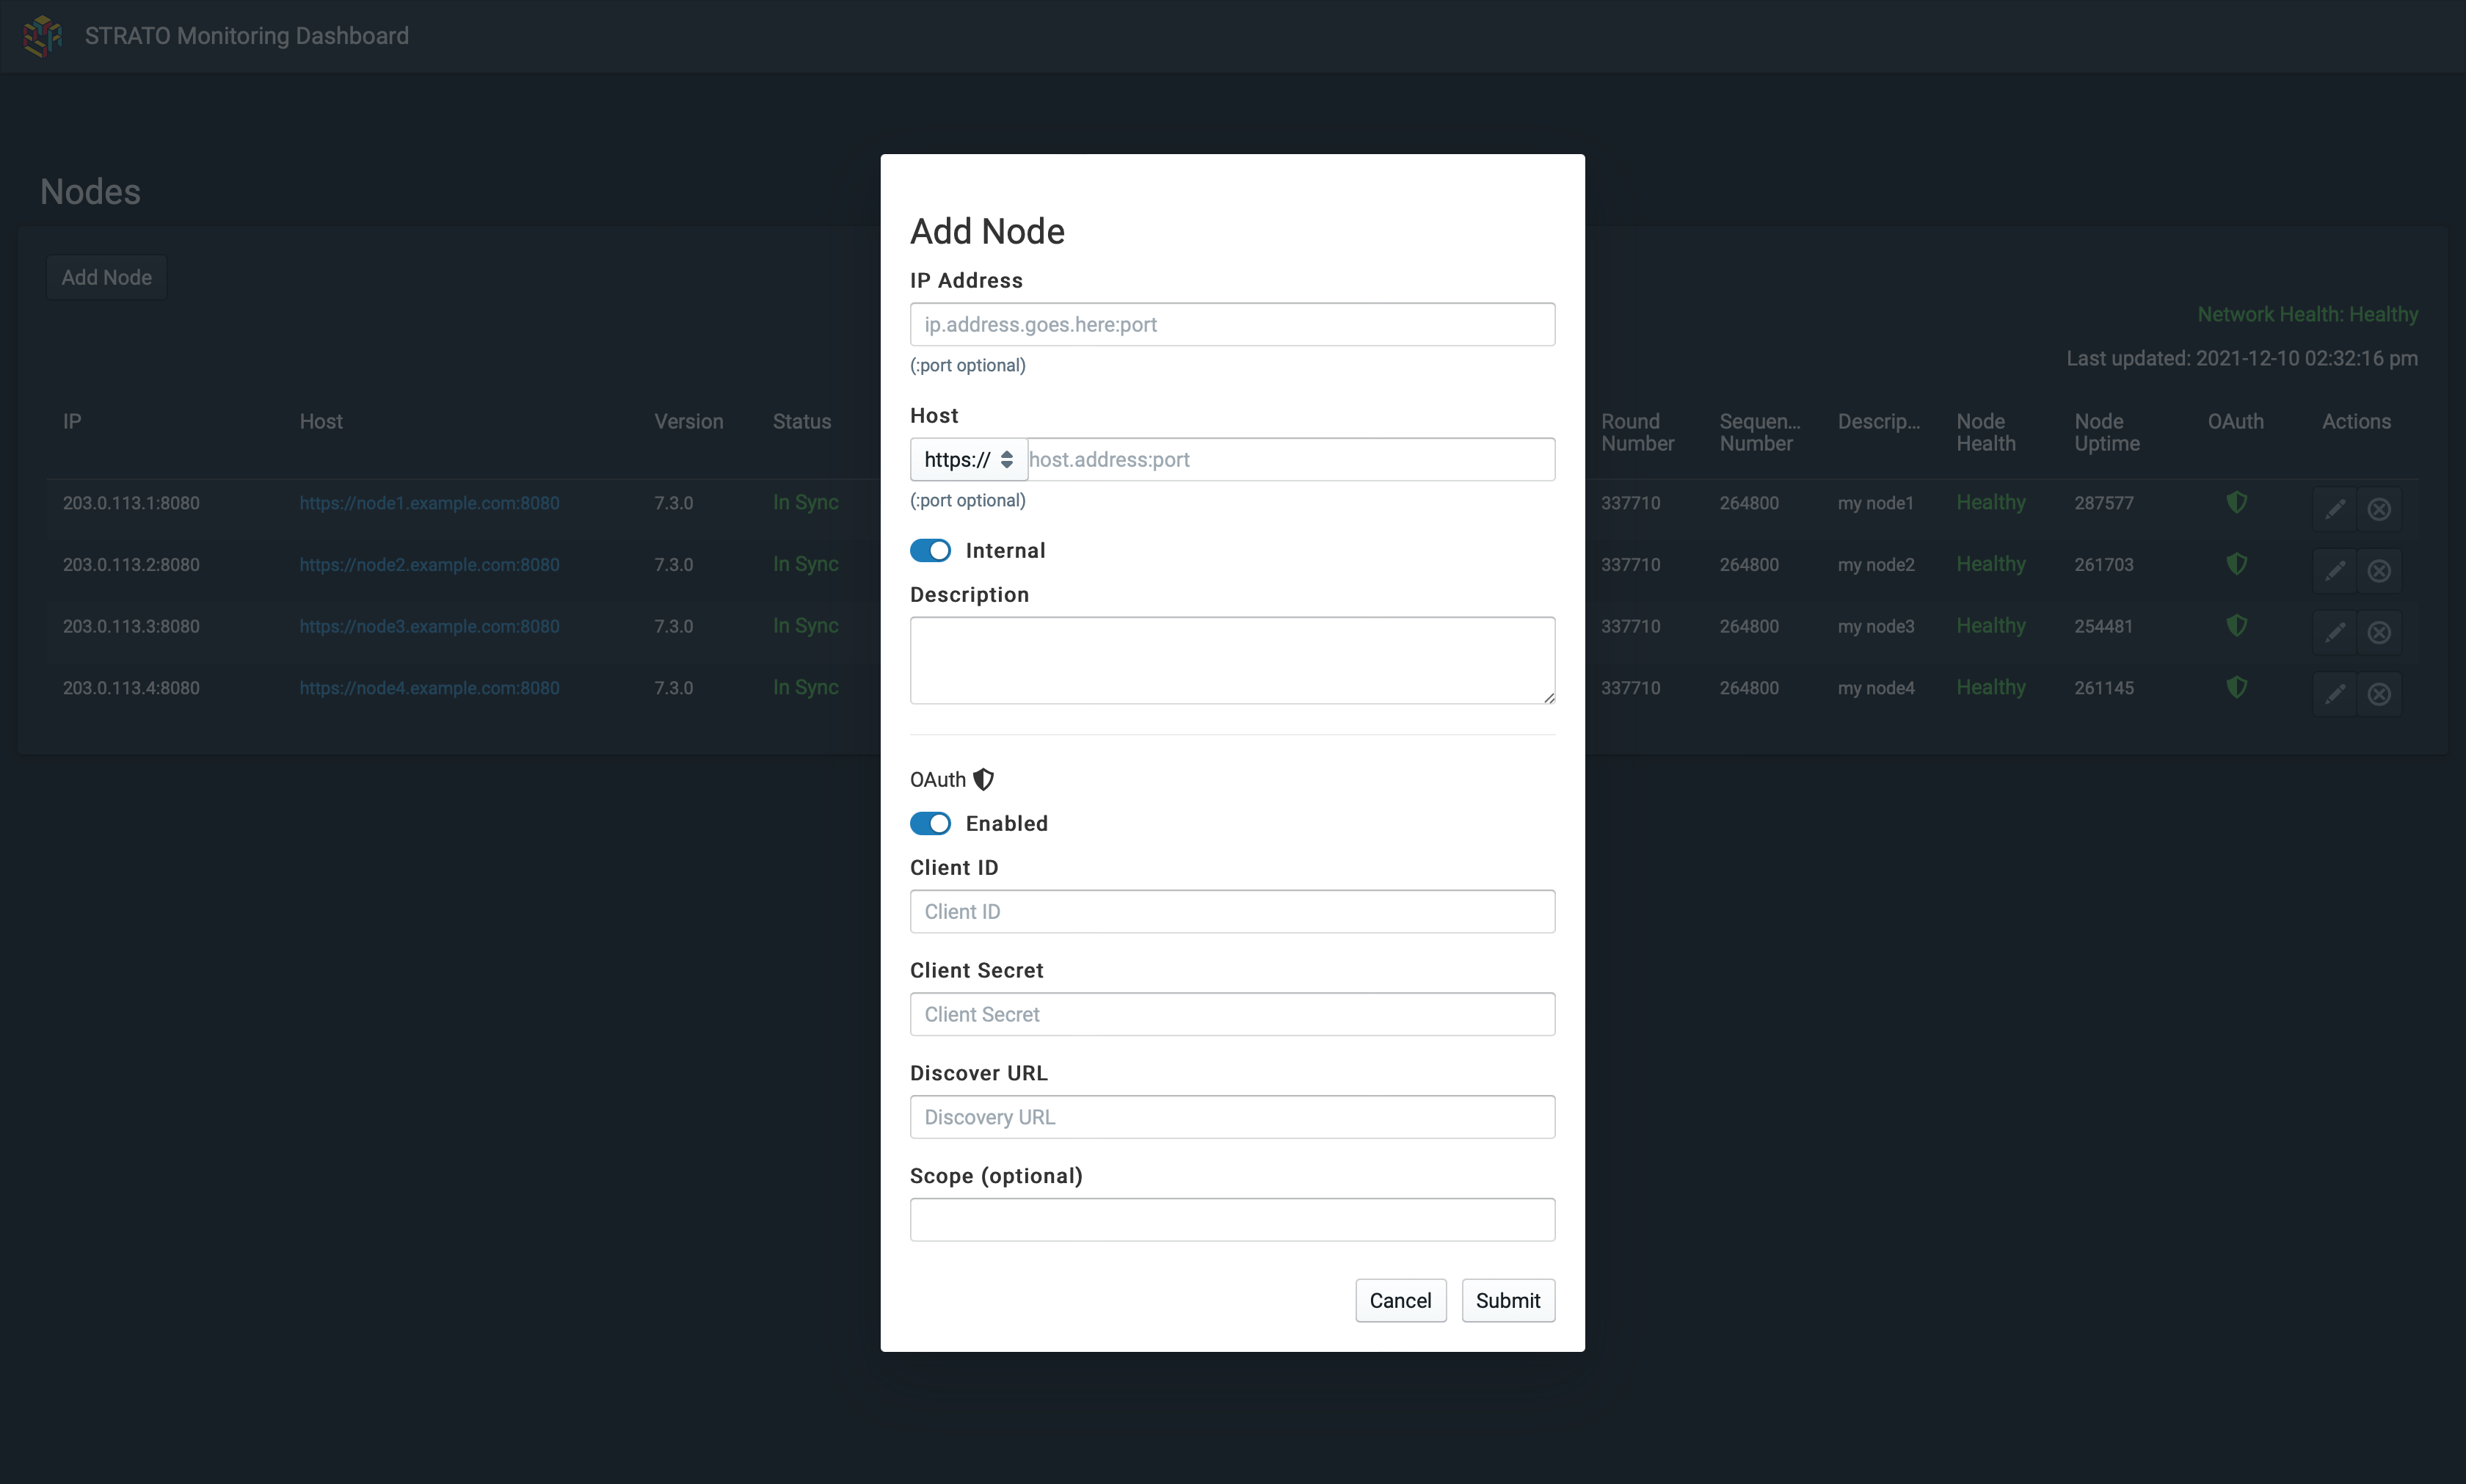
Node information may be created, edited, and removed from a live CMD deployment in the UI:
-
Add Node dialog on the page:
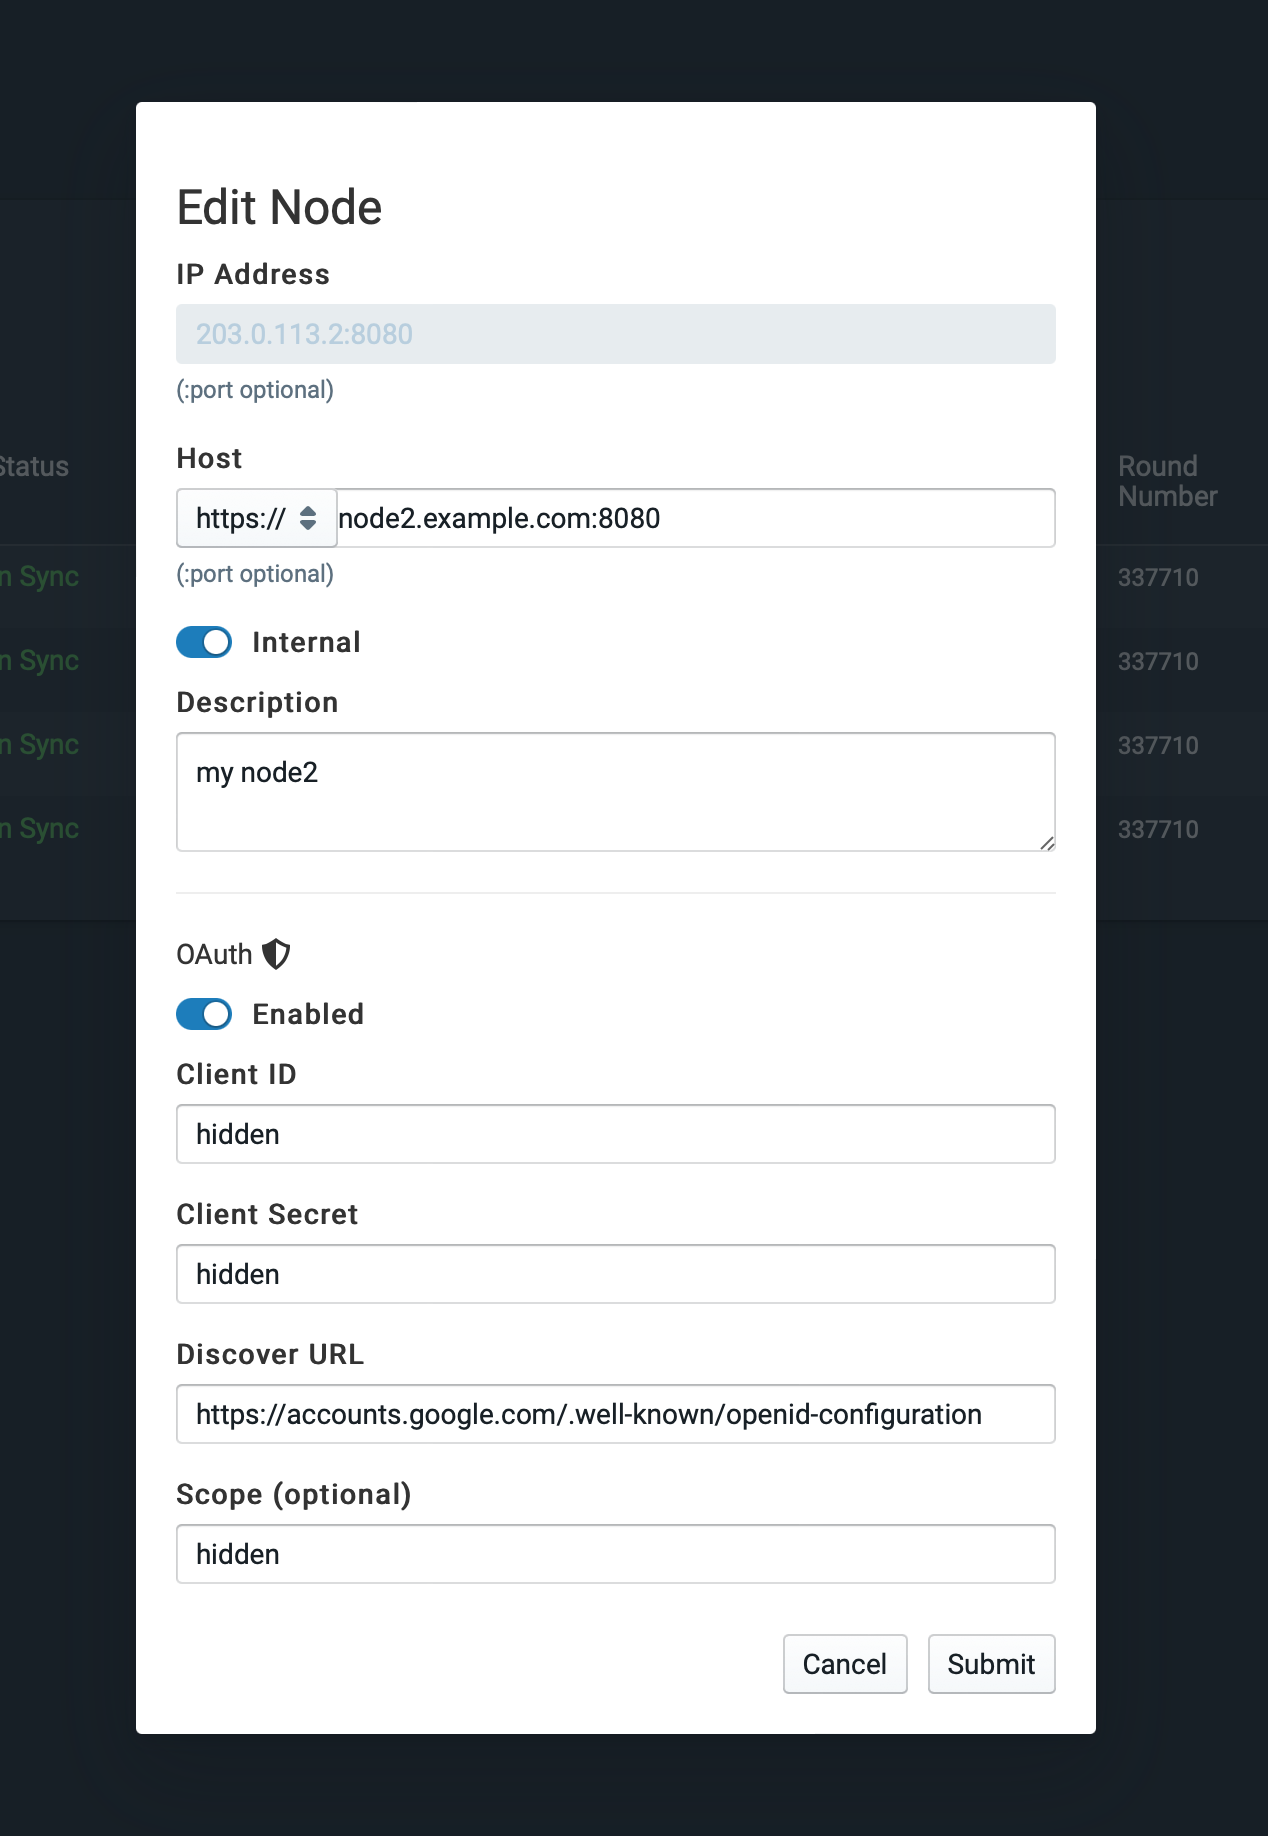
-
Edit Node:
License
Reach out to BlockApps team to get the Central Monitoring Dashboard tool with your STRATO license.